(Update 07.27.2025)
Exocytosis is a fundamental biological process where the intracellular vesicle eventually fuses to the plasma membrane, releasing its content into the extracellular space. To report exocytosis, we take advantage of pH-sensitive probes which are quenched in acidic environment and fluorescently bursts when exposed to a neutral pH environment (e.g. extracellular space).
We developed ExoJ, a computer-vision assisted tool implemented as a Fiji/ImageJ2 plugin to detect and record exocytosis features on single-cell basis. Built-in options allow end-users to immediately review each detected event and further the entire population within one cell.
We define a bona fide exocytosis event as a diffraction-limited object displaying a sudden burst of fluorescence followed by a decayed signal. Additional details are translated into a set of thresholding parameters to fully account of end-user experimental condition and type of vesicle.
Installation
The plugin ExoJ was successfully tested on computers (MAC OS Catalina and newer releases, Windows) with ImageJ2/Fiji 1.53s or newer versions and Java 8 installed.
It requires the prior installation of the plugin Bio-Formats (Linkert et al., J. Cell Biol. 2010) which handles multiple image formats.
Download and copy the .jar file in Fiji/ImageJ2 plugin folder. Restart Fiji/ImageJ2, and the plugin ExoJ should appear in your plugin list under Plugin/Project-ExoJ/ExoJ.
Recommendation
The plugin was designed to automatically detect and record exocytosis from fluorescent time series. It can’t handle 3D time series. We strongly advise to avoid time series displaying saturated pixels.
In case of lateral drift during live cell imaging, we recommend performing registration with available online plugins.
Procedure
The workflow comprises three main steps: (1) Detecting the bright spots seen as vesicles, (2) building 1D time-lapse trajectories and (3) identifying candidate exocytic events according to user definition.
At any points during the procedure, users can save and load detection settings (.dat file).
A pop-up window lists opened files.
For newly-imported files, press Refresh to update the list.
Note that the preset parameters need to be tuned/adjusted otherwise ExoJ performance might be degraded (Chouaib et al., 2024).
STEP 1. Spot detection
METADATA
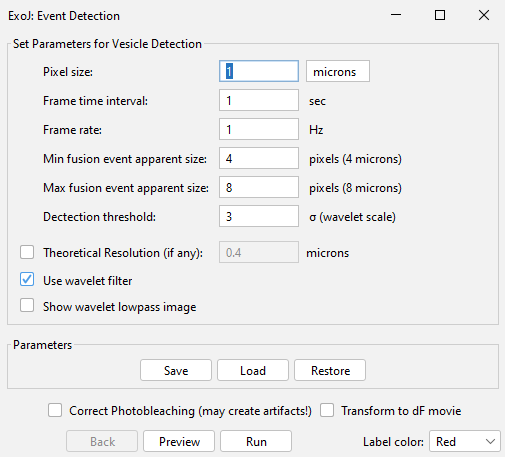
Upon file selection (Open), the plugin reads the metadata to fill the required information in the prompt-up window (Pixel size | Frame time interval | Frame rate).
DETECTION
For spot detection algorithm, we have implemented two options:
– [default option] a Wavelet-based approach (Olivo-Marin 2002). Users are first asked to set a range of wavelet scales that roughly matches the size of the spots of interest (Min. and Max. fusion event apparent size). Pixel values are now accordingly converted to wavelet coefficient values. The detection threshold correspond to the Medial Absolute Deviation (MAD) calculated on wavelet coefficients (σwavelet). Upon activation, the resulting lowpass image is generated for further assessment (Show wavelet lowpass image).
– [Untick Use wavelet filter] The spot detection relies on the Maximum Finder tool implemented on Fiji/ImageJ2. The detection threshold correspond now to the MAD calculated on pixel intensity (σintensity)
The calculation is done on individual frames, and the result can be assessed by pressing Preview.
Both detection approaches can be carried out on first-order differential fluorescent time series (Transform to dF movie). This transformation can be reverted (untick the option). The subsequent steps are performed on raw fluorescent time series.
PHOTOBLEACHING CORRECTION
Live-cell imaging inherently faces photobleaching effect. To account for this, a correction can be performed upon clicking on the dedicated box (Correct Photobleaching). The correction is immediately applied and can be reversed (untick the option). Note that the presence of saturated pixels would most likely generate artifacts after correction.
MISCELLANEOUS
MAD: Median Absolute Deviation is a measure of dispersion based on the calculation of the median of the absolute deviation from the data’s median.
The color of the detected spots can be changed using the drop down list (bottom right-hand side, Label color).
Press Run to start the Spot detection.
You can Save your detection parameters or Load previous ones.
STEP 2. Spot tracking
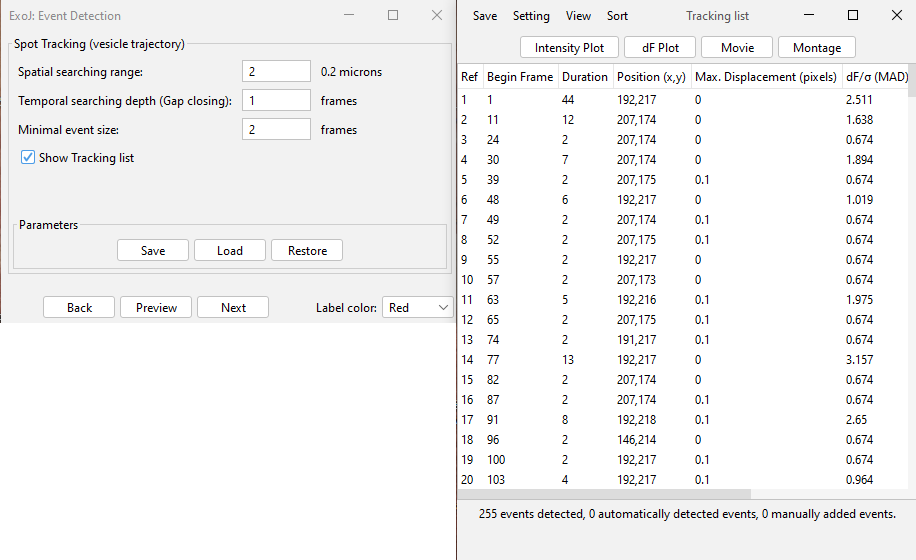
The next step consists in building 1D time lapse trajectories using previously detected spots.
PARAMETERS
Three user-defined parameters are required to define spot trajectories
– Spatial searching range: spots located within a circular region centered on the detected spot, with a user-specified radius will be linked. If two or more spots fall within the region, the “closest” will be chosen.
– Temporal searching depth (Gap closing): this parameter defines the maximum number of consecutive frames that can separate two linked spots. By default, a gap tolerance of 1 frame enforces strict temporal continuity, requiring spots to be detected in every frame. For a gap of 2 and more, the missing frames are filled with a virtual spot corresponding to the timepoint preceding the gap.
– Minimal event size: a threshold is applied to the minimum number of spots required to be considered as a valid trajectory.
PRACTICAL CONSIDERATION
These three parameters are highly dependent on imaging modality and settings, such as pixel size and frame rate.
We assumed that fusion events are recorded across at least two consecutive images (i.e. two detected spots). Otherwise, detecting a single spot might indicate a vesicle moving in and out of focus, not necessarily a genuine fusion event. If you proceed with single-frame detections, ensure the Minimal event size parameter is set to 1 to prevent self-imposed limitations on ExoJ detection performance (Lachuer et al., 2024).
MISCELLANEOUS
Tracking results can previewed (Preview button). The list of reconstructed trajectories can be displayed if Show Tracking List is activated prior to pressing Preview or Run .
You can use the Back button to go back to the previous step (Spot detection).
STEP 3. Event Identification
To identify bona fide exocytosis events, the last step is made fully user-configurable.
Version 1.83 Version 1.9
PARAMETERS
Fitting procedure (mean lifetime and estimated apparent radius)
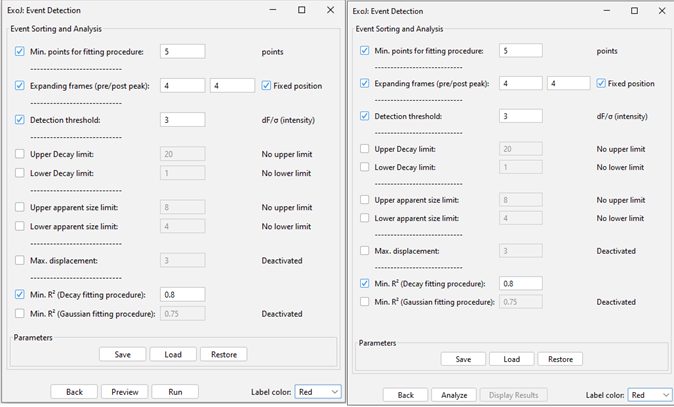
– Min. points for fitting procedure: minimal number of data points required to start fitting procedure. We recommend to leave it to the default value 5.
– Expanding frames (pre/post peak): number of additional frames on top of reconstructed trajectories (from step 2).
Increasing the number of pre-peak frames would refine the local background calculation (and hence the Detection threshold).
Increasing the number of post peak frames will affect the Gaussian fitting procedure for estimating the mean lifetime.
The Fixed position option enables additional frames to be either tracking maximum intensity (unticked) or stationary at their previous spatial position (ticked).
– Min. R2: If ticked, minimal Goodness-of-fit is used as a hard threshold to select bona fide events.
Exocytosis event
– Detection threshold: Similarly to step 1, events are selected according to the MAD calculated on each trajectory (+/- pre/post peak frames). Only candidate events above the detection threshold value will be considered.
– Upper/Lower Decay limit: Setting the allowed range for how long events can last (mean lifetime is derived from a 2D Gaussian function)
If no Lower Decay limit is set, the fitting process can yield negative mean lifetime values. For users who prefer alternative fitting functions, the raw data for each identified event is available in the latter step for further analysis.
– Upper/Lower apparent size limit: The apparent size is derived from the intensity profile (at the onset of the event) by fitting a 2D Gaussian function. The Full Width Half Maximum is used as a proxy for the event apparent size. The raw data for each each identified event is also available in the latter step.
If none of these two parameters are activated, the apparent size won’t be derived from the 2D Gaussian fitting procedure.
– Max. displacement: Maximal displacement allowed throughout the exocytosis event.
PRACTICAL CONSIDERATION
Increasing the number of pre/post peak frames could hinder the detection of two closely-timed events at the same location.
User-input values are in pixel unit for Upper/Lower Decay limit, Upper/Lower apparent size limit and Max. displacement.
MISCELLANEOUS (version 1.83)
Results for identified events can previewed by pressing the Preview button).
A new window (Result table named ExoJ: Detected exocytosis list) will pop up, listing all events and the associated features and parameters.
You can use the Back button to go back to the previous step (Spot tracking).
MISCELLANEOUS (version 1.9)
Proceed with the Event Identification by pressing the Analyze button.
When done, a pop-up window will show up, inviting you to press the Display Result button. A new window (Result table named ExoJ: Detected exocytosis list) will pop up, listing all events and the associated features and parameters.
You can use the Back button to go back to the previous step (Spot tracking).
Note that you can press the Display Result button during the Event Identification process to get a current view of the analysis.
Results
A pop-up table now provides a detailed list of all identified exocytosis events, including their normalized intensity (density), mean lifetime (duration) and estimated size.
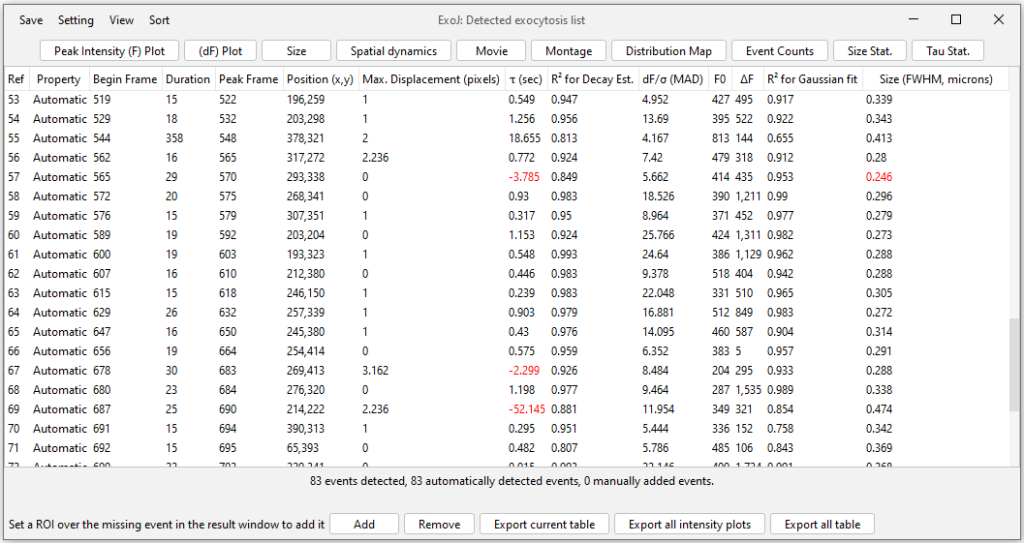
Top buttons are shortcuts to display:
– Peak Intensity (F) Plot: Fluorescence peak intensity F over time
– (dF) Plot: First-order differential Fluorescence peak intensity dF over time
– Size: 2D intensity profile and its associated Gaussian fitting
– Spatial dynamics: Recording the radial peak intensity profile over time. Event XY position is used as a central point.
– Movie: Generating a 9-by-9 pixel timeseries tracking the selected event
– Montage: Generating a custom montage using the Movie
– Distribution Map: Spatial distribution of identified events
– Histograms (Event counts, Size Stat., Tau Stat.): Generating the corresponding histogram on the number of identified events, their apparent size and mean lifetime.
TIPs
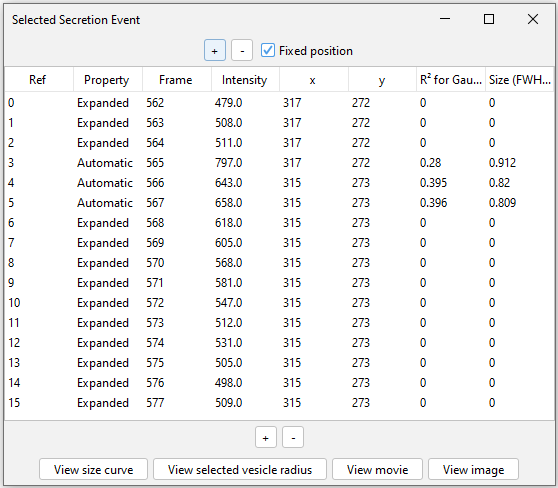
Raw data can be accessed by double-clicking on the corresponding identified event. A pop-up table (Selected Secretion Event) provides the recording of quantitative features for the selected event.
+/-: add frames pre and post peak a posteriori. Table will be updated to include additional frames (added frames will be Referenced with 0 and Property named as Custom).
View size curve: Displaying the event FWHM over time.
View selected vesicle radius: First, select a frame (i.e. line in the table). Display the XY plot used to derive the FWHM
View movie: Generating a 9-by-9 pixels timeseries centered on the selected event.
View image: Generating a still image corresponding to the selected timepoint in the table.
Mean lifetime and Size (FWHM, microns) estimation could be flagged in red for the following reasons:
– for mean lifetime ≤ 0 (unit), the estimated value will be colored in red. The button Lower apparent size limit was not activated (unticked). This is not a perfect solution, but this allowed the detection of exocytosis events with “positive slope”
– for the estimated apparent size (FWHM) the estimated value is compared to the theoretical resolution (STEP 1) if filled by users. Note that the estimated apparent size won’t be displayed if one of both buttons related to the apparent size limit is/are not activated (unticked).
Event spatial kinetics (fast-/slow- or confined-spreading) can be estimated using the Spatial dynamics button similarly to Bowser and Khakh work (Bowser and Khakh PNAS 2007). Here we use rings (1-pixel wide) rather annuli.
References
Olivo-Marin, J.-C. (2002). Extraction of spots in biological images using multiscale products. Pattern Recognition, 35(9), 1989–1996. https://doi.org/10.1016/S0031-3203(01)00127-3
Linkert, M., Rueden, C. T., Allan, C., Burel, J.-M., Moore, W., Patterson, A., Loranger, B., Moore, J., Neves, C., MacDonald, D., Tarkowska, A., Sticco, C., Hill, E., Rossner, M., Eliceiri, K. W., & Swedlow, J. R. (2010). Metadata matters: access to image data in the real world. Journal of Cell Biology, 189(5), 777–782. https://doi.org/10.1083/jcb.201004104
Bowser, D. N. and Khakh, B. S. (2007). Two forms of single-vesicle astrocyte exocytosis imaged with total internal reflection fluorescence microscopy. Proc. Natl. Acad. Sci. U.S.A., 104 (10) 4212-4217. https://doi.org/10.1073/pnas.0607625104
License
Copyright (C) 2022 – LIU Junjun, BUN Philippe
ExoJ is an Image/Fiji plugin to automate the detection and the analysis of exocytosis in fluorescent time series.
This program is a free software: you can redistribute it and/or modify it under the terms of the GNU General Public License as published by the Free Software Foundation, either version 3 of the License, or (at your option) any later version.
This program is distributed in the hope that it will be useful, but WITHOUT ANY WARRANTY; without even the implied warranty of MERCHANTABILITY or FITNESS FOR A PARTICULAR PURPOSE. See the GNU General Public License for more details.
You should have received a copy of the GNU General Public License along with this program. If not, see https://www.gnu.org/licenses/.
Citation
Junjun Liu et al., . ExoJ – a Fiji/ImageJ2 plugin for automated spatiotemporal detection and analysis of exocytosis. J Cell Sci (2024) 137 (20): jcs261938. https://doi.org/10.1242/jcs.261938
Download
Contact
Feel free to contact us regarding the plugin features and suggested improvements.